
APP SCREENS
One site visit, five screens.
The five frames below are taken from the Location Analysis Mobile interface. The mapped area is Kadıköy, İstanbul, and the order is the order of a site visit.
01
Map and search
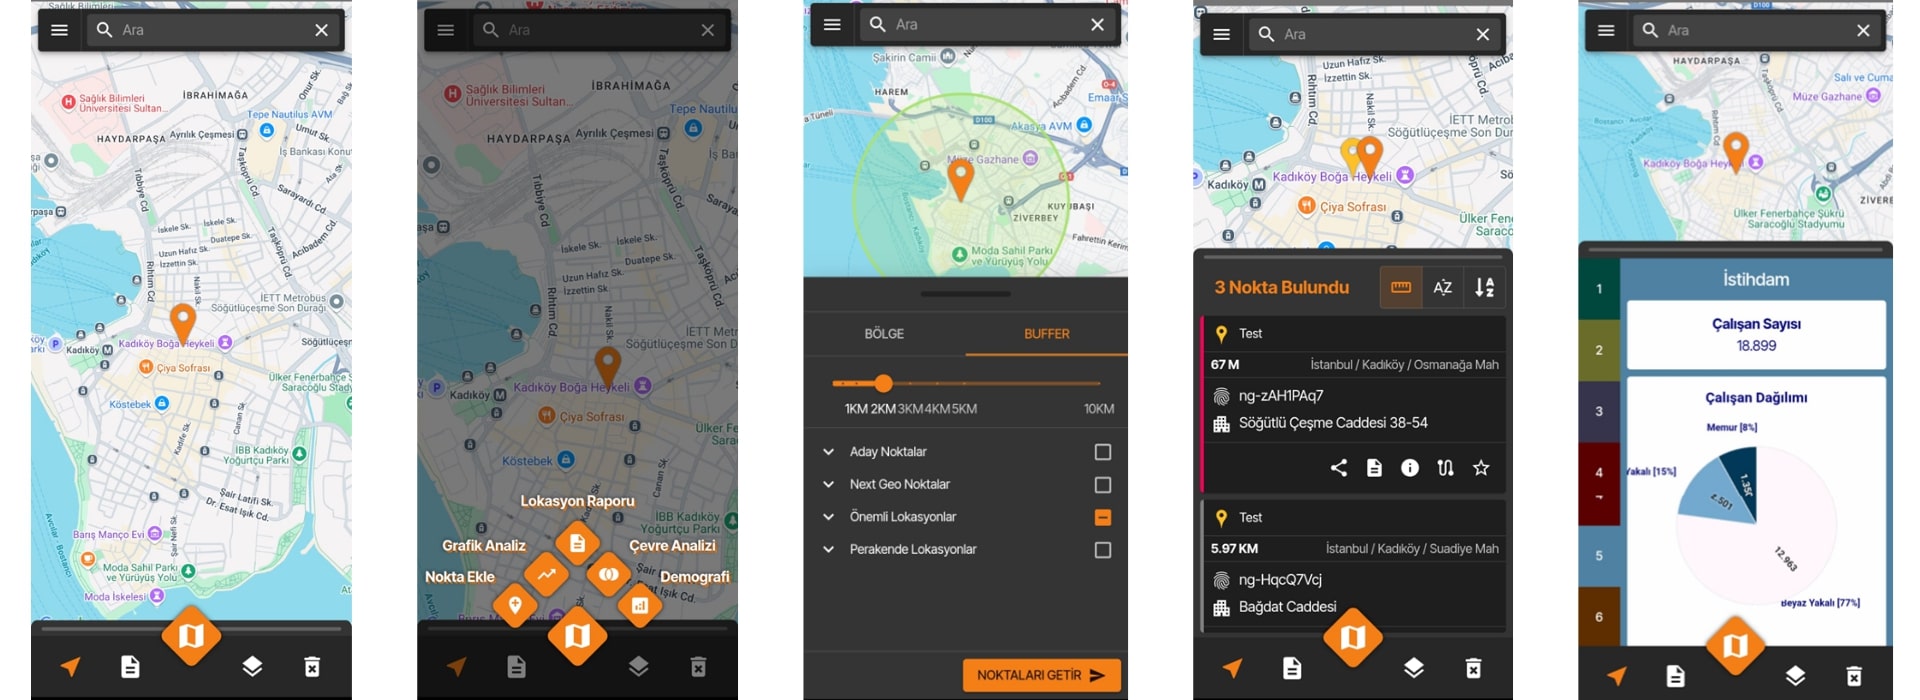
The address search field and the marked site. The five buttons along the bottom are the application’s fixed toolbar.
02
Quick action menu
The fan that opens at a site: Lokasyon Raporu (location report), Grafik Analiz (graphic analysis), Çevre Analizi (surroundings), Nokta Ekle (add point), Demografi (demographics).
03
Area and radius
BÖLGE (district) or BUFFER, a 1–10 km radius, and four layers: candidate sites, Next Geo’s own points, important locations, retail locations.
04
Points found
“3 Nokta Bulundu” — three points found. Each row carries distance, district, neighbourhood and street, then share, report, information, route and favourite.
05
Demographic charts
The employment breakdown for the selected area. Population, socio-economic status and urbanisation are read on the same screen.
The screenshots are taken from the application itself and its interface is in Turkish. The site names, identifiers and figures visible inside the screens belong to one example study; your own installation shows your own points and your own layers.
FOUR JOBS THOSE SCREENS DO
Four of the application’s eight capabilities, each in its own frame and named under it. All eight are set out in words in the next section.


APPLICATION FEATURES
Eight capabilities, two halves of a visit.
The eight headings are the ones the Products page already lists on the Location Analysis Mobile card. Here they are split in the order a site visit actually happens: first the site is captured, then the decision is made.

FIRST HALF
Capture in the field
Search for the site, build the route, record it on the spot with a name, an address and photos, and share it with the team. When the visit ends, the site is a record.
-
Adding Points
During field studies, save your candidate locations through the application by adding name, address, and photo. Create a digital memory of each location.
-
Address Search & Adding Favorite Locations
Easily search for the location you’re interested in, save frequently used addresses, and add them to your favorites for later access.
-
Route Creation
Create routes between your saved addresses and your current location; facilitate your field planning with distance and time information.
-
Location Sharing
Strengthen field coordination by instantly sharing important addresses with your teammates.
SECOND HALF
Decide on the spot
Produce that site’s report, its demographic charts and its comparison against a second candidate on the phone, without going back to a desk.
-
Generating Location Reports
Instantly generate a detailed AI-powered report for any location you’re interested in, including data on demographics, retail score, competition, pedestrian traffic, rental value, and street view.
-
Graphic Analysis
Analyze demographic indicators such as population, socio-economic status, urbanization, and employment in graphs on your mobile device. Don’t just view the data; understand it.
-
Creating Comparison Reports
Compare two different candidate locations and see which is more advantageous with data-driven analyses.
-
Traffic Layer
Prioritize highly accessible locations by examining traffic density live.
The grouping is a reading order, not a separate family of modules: all eight capabilities live in the same application and run on the same Next Geo data infrastructure. The headings and their descriptions are the ones listed on the Location Analysis Mobile card on the Products page.
SAMPLE OUTPUT
What do you leave the site holding?
The first panel is the record a field team leaves at the site. The second is that same site compared against a second candidate. Both are outputs of the eight capability headings above, and both are produced on the phone before anyone gets back to a desk.

FIELDS FILLED IN AT THE SITE
- Site name
- Candidate 01 · Söğütlü Çeşme
- Address
- Söğütlü Çeşme Cad., Osmanağa Mah.
- District / city
- Kadıköy / İstanbul
- Coordinates
- 40.9899 · 29.0255
- Photos
- 3 frames
- Added to favourites
- Yes
- Added to route
- 1.4 km · 6 min
- Shared with team
- 2 people
All eight fields are filled in on the phone while standing at the site. Nobody searches for that address again: it sits in favourites, on the route and in the team’s list as a single record.
TWO CANDIDATES, SAME CRITERIA
| CRITERION | A · Söğütlü Çeşme | B · Bağdat Cad. |
|---|---|---|
| 10-min drive population | 84,300 | 61,500 |
| Retail score | 78 | 71 |
| Competitors within 10 min | 6 | 3 |
| Pedestrian traffic | High | Medium |
| Rental level | High | Medium |
| Report result | AHEAD | — |
The five criteria are the fields of the location report, set side by side for two sites. A is busier and has heavier footfall, but competition and rent are higher there too; the score is what reduces that trade-off to one number.
Sample output. The figures are illustrative. A real report is produced from your own candidate sites; the ten-minute drive band is the same frame used by the other samples on this site.