

SOLUTION · LOCATION AND AREA SELECTION
Where should the next site open?
The Solutions page asks that question against this page, and states the deliverable as: a potential score for each candidate site, and one report consolidating every analysis. One question, two scales — and the page is built from those two.
If you want to open a new store, expand your service area, or optimize your current location, the basis of your decision is the question “Where should we be?”. Next Geo answers this question not only with maps, but with multi-layer data analysis and artificial-intelligence supported models.
- 6ANALYSIS ELEMENTS
- 4STEPS
- 2SAMPLE OUTPUTS
All three numbers are countable from this page: the six analysis elements indexed above, the four steps Next Geo publishes for this solution, and two sample output panels.
ANALYSIS ELEMENTS
Six elements, two scales.
The first three choose the area: which province, district and neighbourhood, and next to whom. The last three choose the point inside it: which street, which avenue, which part of the mall. The split comes from Next Geo’s own four steps — each element is an input to a named one.

Area: where should we be, and next to whom?
A scan at province, district and neighbourhood scale. These three decide which area you are in, and who you stand beside.
Demographic Compatibility
We enhance your decision-making by pinpointing the residential, professional, and retail areas frequented by your target demographic. Our neighborhood-level demographic analysis ensures optimal proximity to your ideal customer base.
Competitive Landscape Analysis
We conduct detailed evaluations of competitor brand locations and performance metrics. By analyzing interactions with your existing branches, we identify strategic opportunities to gain a competitive edge.
Influence of Key Attraction Points
We analyze high-traffic areas, such as educational institutions, healthcare facilities, and public sector offices, to guarantee that your location choices maximize traffic and visibility.
Site: which is the most accurate point?
A street, an avenue or a unit inside a shopping mall. These three decide where you stand inside the area you chose.
Mobile Mobility
We analyze pedestrian and vehicle traffic data along with time-based intensity patterns to uncover mobility trends. By identifying a location’s position within real-time human flow, we help you measure when and where potential customer traffic is highest throughout the day.
Retail Ecosystem and Brand Synergy
We assess the current retail environment of streets or shopping centers, considering customer demographics, foot traffic, and category distribution. We recommend locations that emphasize your brand’s unique value proposition, rather than simply blending in.
Rental Cost & Commercial Sustainability
We evaluate regional rental averages and compare them on a per-square-meter basis for your target locations. By balancing potential returns with costs, we identify investment points that are not only efficient — but also sustainable in the long run.
The area / site split is a reading order, not a separate package: all six run on the same data infrastructure and all six resolve into one score — which is exactly what the table below is.
SAMPLE OUTPUT · FIRST PANEL
Four candidate areas, six elements, one table.
The first half of what the Solutions page states for this solution: a potential score for each candidate. The score is never given as one number on its own — it is given with the six elements that produced it, so an area can lead the list and still show where it is weak.

| CANDIDATE AREA | DEMOGRAPHY | COMPETITION | ATTRACTION | MOBILITY | RETAIL | RENT | SCORE |
|---|---|---|---|---|---|---|---|
| Kadıköy | 92 | 78WEAKEST | 90 | 86 | 84 | 92 | 87 |
| Ataşehir | 88 | 84 | 86 | 83 | 80 | 71WEAKEST | 82 |
| Göztepe | 84 | 82 | 80 | 68WEAKEST | 79 | 81 | 79 |
| Ümraniye | 79 | 74 | 70 | 72 | 60WEAKEST | 71 | 71 |
The columns are the six analysis elements above, in the same order. Every cell is out of 100. The lowest cell in each row is flagged: that is where the area is weakest. The last column is the mean of the six cells beside it — in this sample the six are weighted equally. In real work the weights are set for your sector and your business model, and the table is recalculated with them.
Sample output. The figures are illustrative. The real table is produced from your own candidate areas. The district names are examples only and do not represent any brand’s investment plan; no customer data, revenue figure or case result is published on this page. The scores are the same values the other sample outputs on this site use.
SAMPLE OUTPUT · SECOND PANEL
Then one decision report.
The point at the top of the table, opened up element by element. The same report is produced for every candidate site; this is what you read once you have accepted the ordering.

SCORE AND FINDING BY ELEMENT
- Demographic Compatibility 92 84,300 people within a 10-minute drive
- Competitive Landscape Analysis 78 4 comparable brands within 500 m
- Influence of Key Attraction Points 90 School, hospital and public office within 500 m
- Mobile Mobility 86 Foot traffic peaks 12:00–14:00 and 18:00–20:00
- Retail Ecosystem and Brand Synergy 84 2 complementary and 1 competing category on the street
- Rental Cost & Commercial Sustainability 92 Rent per m² below the area average
- Potential score 87 Mean of the six elements · out of 100
THE COMMENT IN THE REPORT
The candidate site leads the list because the population around it and the attraction points near it are both strong. The lowest-scoring element is the competitive balance: re-measuring the density of comparable brands within 500 metres before opening is recommended.
In this sample the six elements are weighted equally and their mean is 87 — the first row of the table above. In real work the weights are set for your sector and your business model. The comment in the report is written by GeoBrain, the AI layer that reads the score and the layers underneath it.
Sample output. The figures are illustrative. The real report is produced from your own candidate site; no customer data, revenue figure or case result is published on this page.
FOUR STEPS
From the area to the point, in four steps.
The first scans at national scale, the second reads the surroundings, the third comes down to the street, the fourth produces the score and the report. The order is the one Next Geo publishes for this solution.
-
NATIONWIDE · PROVINCE, DISTRICT, NEIGHBOURHOOD
Regional Scanning: Where Should We Be?
By using Next Geo’s data library, we determine regions that contain potential, on the scales of provinces, districts and neighborhoods throughout Turkey. We perform the first scan with variables such as demographic structure, income level, transportation axes and population density.
- Demographic structure
- Income level
- Transportation axes
- Population density
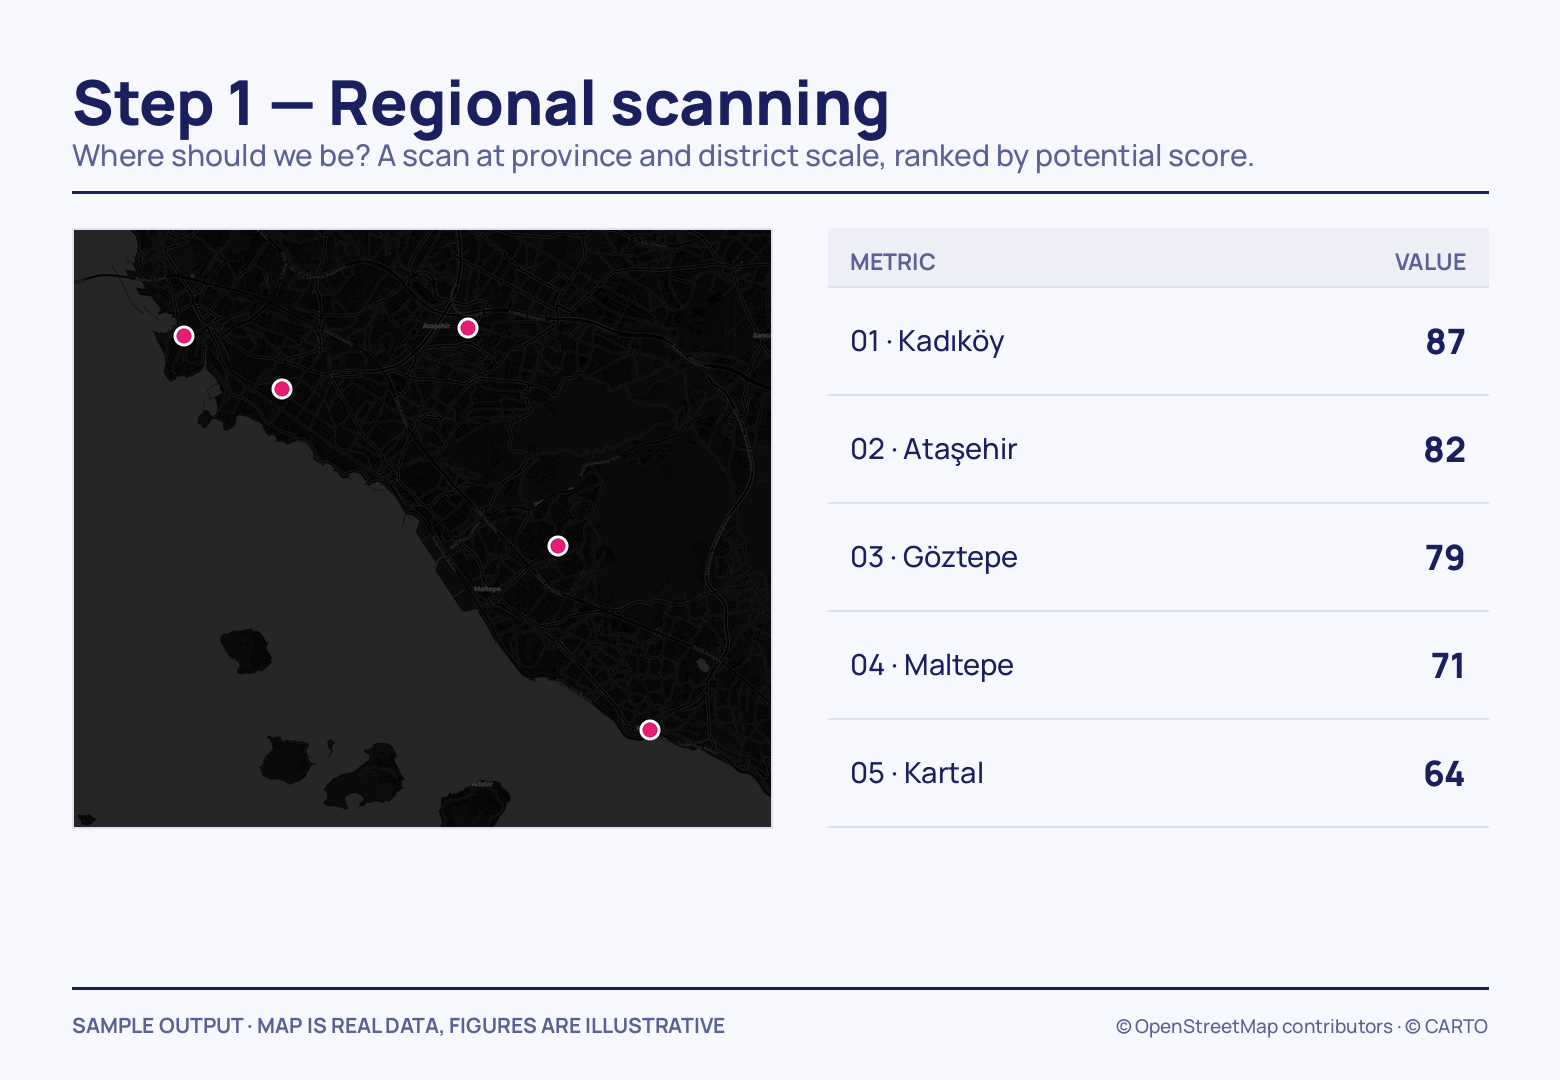
Regional Scanning — candidate areas scanned, one coming out ahead -
THE SURROUNDINGS OF THE AREA
Competition and Environment Analysis: Who Should We Be Beside?
The locations of your competitors, industry density, and attraction points (shopping malls, schools, hospitals, etc.) are analyzed. This allows us to both prevent overlaps and reveal environmental advantages that will support you.
- Competitor locations
- Industry density
- Shopping malls
- Schools
- Hospitals
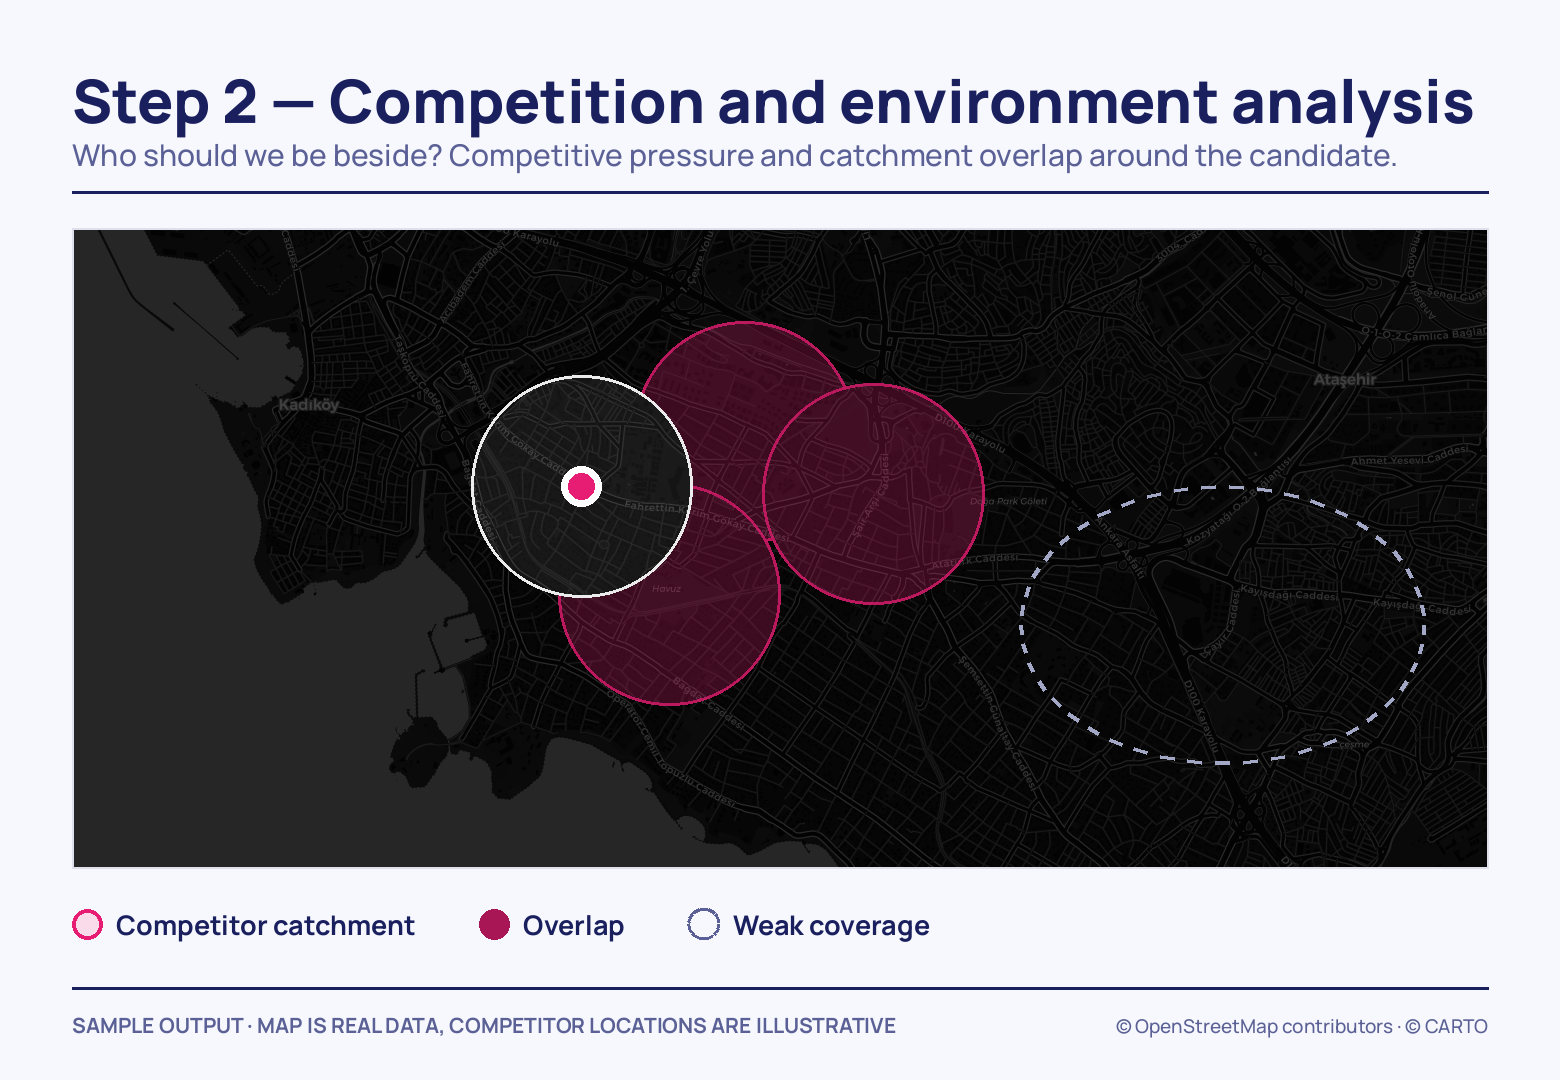
Competition and Environment Analysis — overlapping catchments, open ground -
STREET · AVENUE · INSIDE A MALL
Micro Location Assessment: Which is the Most Accurate Point?
Micro locations such as streets, avenues, or shopping mall interiors are analyzed. We provide point-based decision support with data such as pedestrian traffic, rental value, competition density, accessibility, and environmental profile.
- Pedestrian traffic
- Rental value
- Competition density
- Accessibility
- Environmental profile
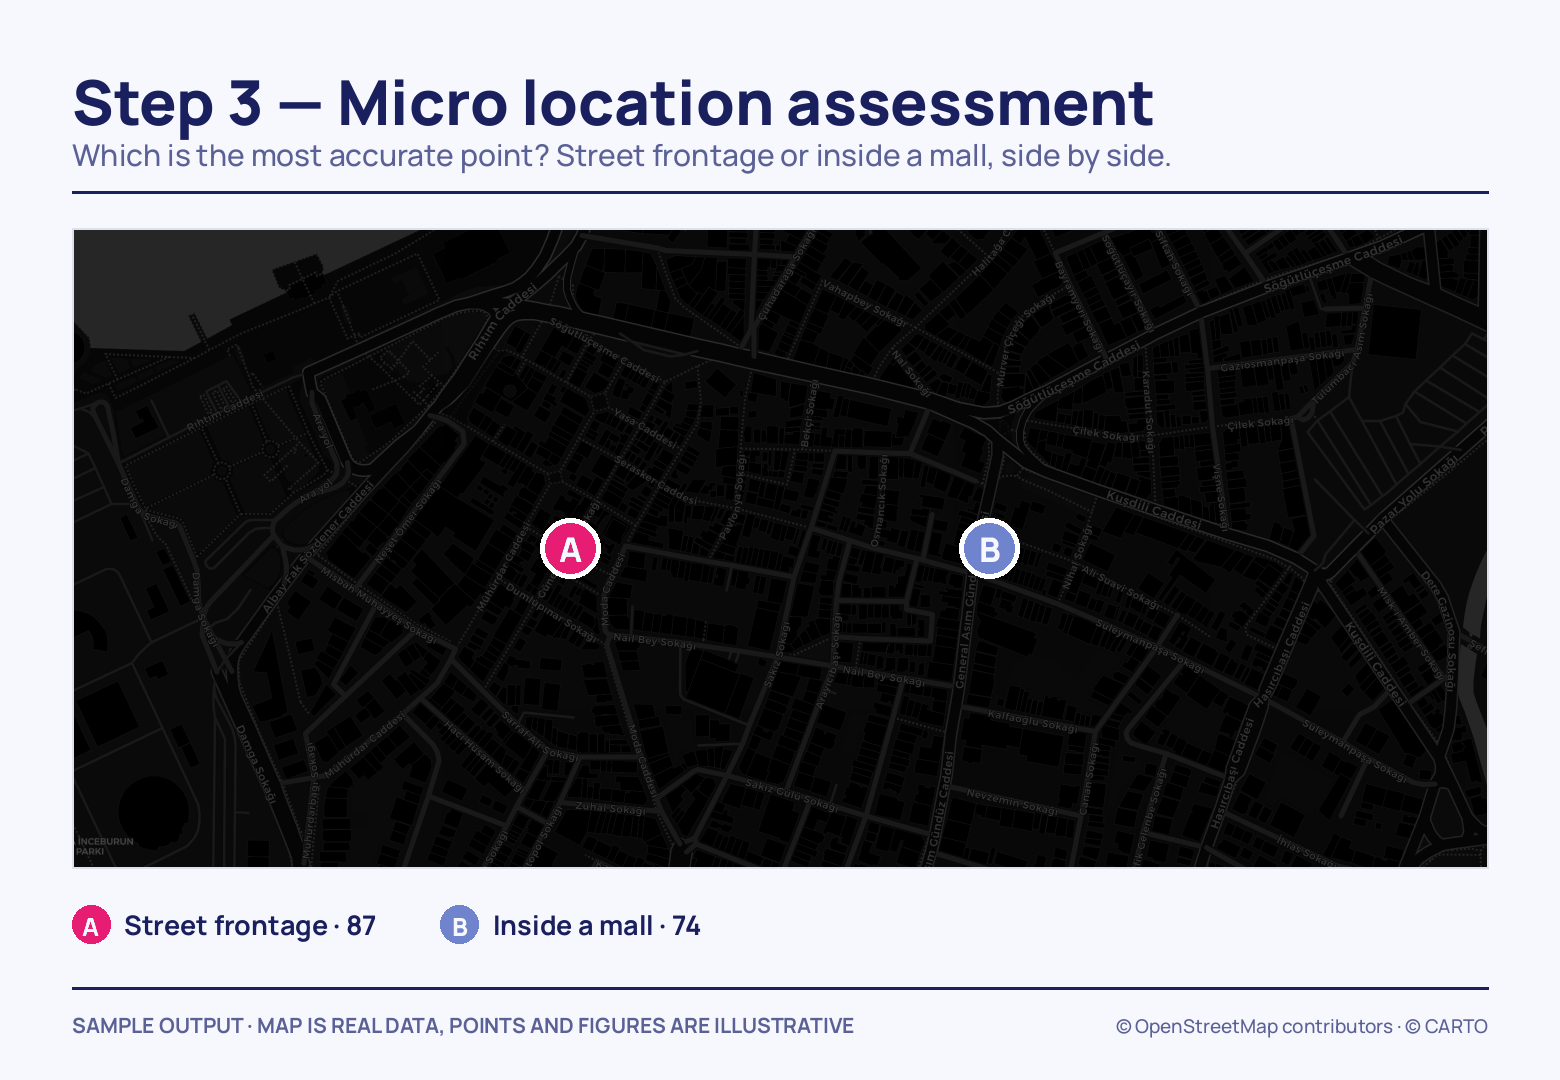
Micro Location Assessment — two candidate points side by side -
ONE POINT · ONE REPORT
Potential Scoring and Reporting: Make the Decision, Rely on Data
We calculate the potential score of locations with AI-powered models. We consolidate all analyses into a single report, enabling you to base your final investment decision on the most solid foundation.
- Potential score
- Single report
- Decision support
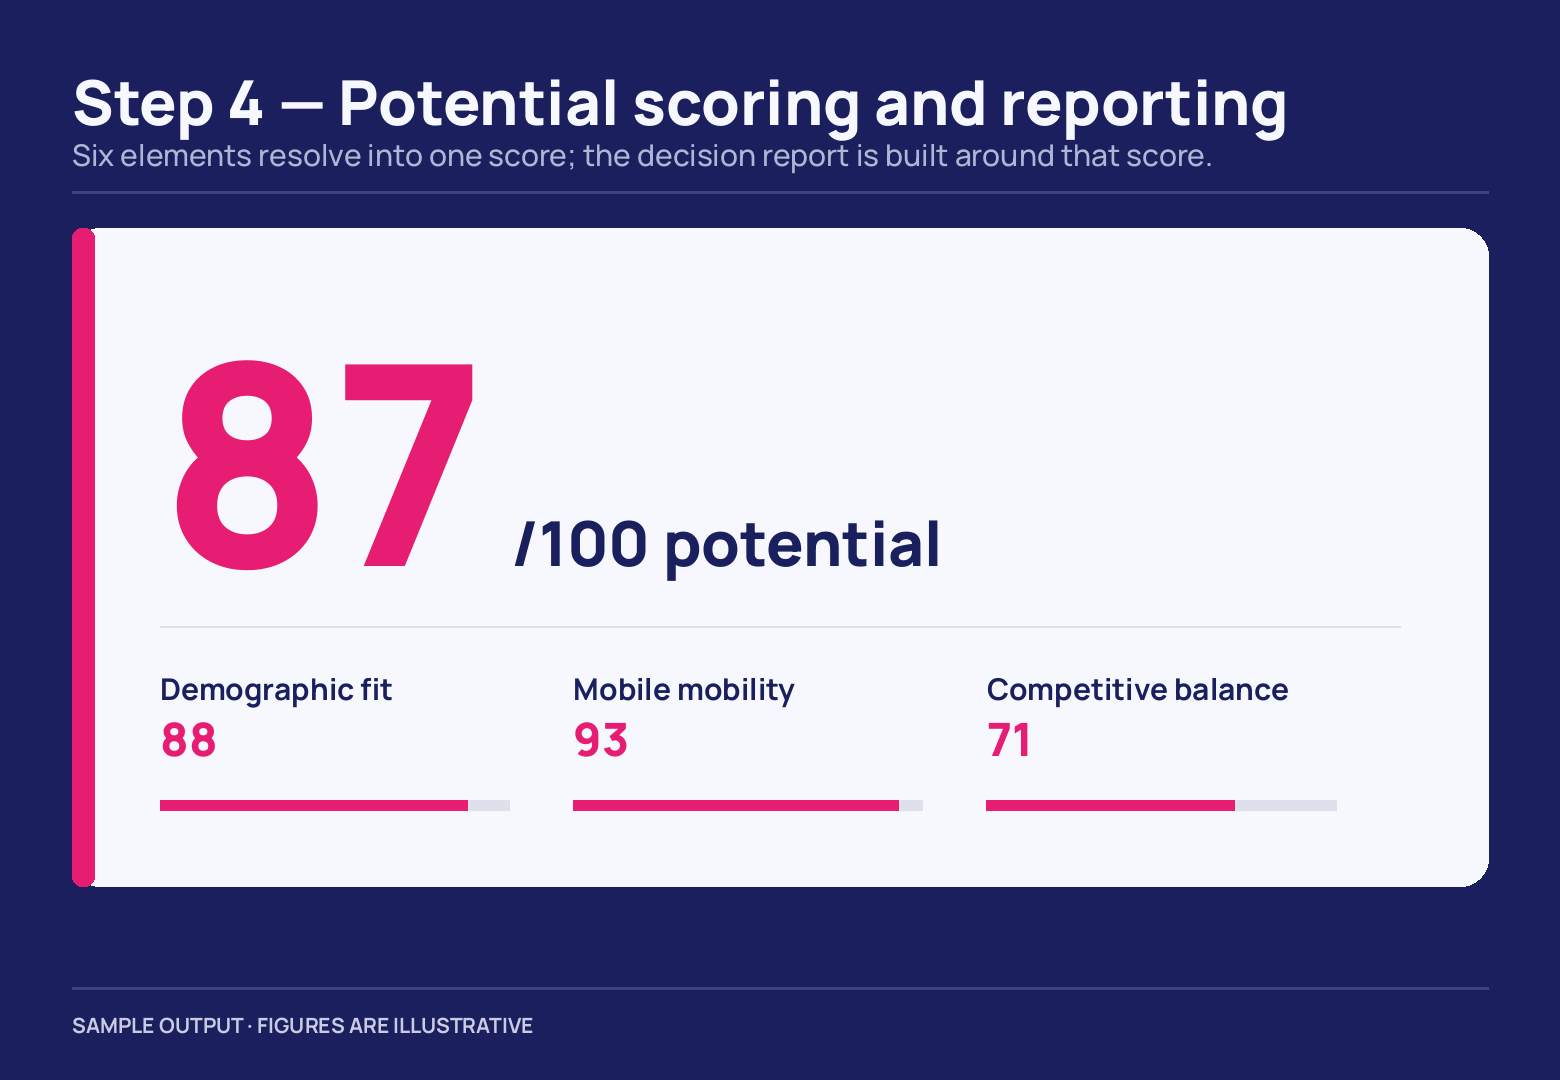
Potential Scoring and Reporting — six elements, one score, one report


Step 01 asks two things of you: which areas you are considering — or, if you have not narrowed it down, at what scale you are looking — and your existing site list if you have one, because the interaction with your own branches is measured in step 02. Matching, de-duplicating and verifying address rows is Data Services’ work; how much the chosen point will sell is Forecasting’s; drawing the candidate area on the map yourself is what Location Analysis Web is for; the surroundings of a single address in one document is Point Report.
This page also absorbed the topic that used to sit under “Targeting”: where your target audience lives, works and shops is an input to step 01. Splitting that same audience into customer groups — who is where, and what do they want — is what the Segmentation solution does.