

PRODUCT · LOCATION ANALYSIS WEB
Compare candidate sites on one screen.
The need this product answers on the Products page: “Compare candidate sites for a new branch or store.”
Location Analysis Web is an AI-powered, web-based analysis and decision support platform. It allows you to visualise Next Geo’s rich data library, upload your own data, and shape your location-based decision-making processes with data.
- 5CAPABILITIES
- 2INSTALLATION MODELS
- 3USER PROFILES
All three numbers can be counted from this page: the five capability rows below, the two installation models — cloud and on-premise — and the three user profiles the platform describes.
THE NEED, IN THREE MOVES
-
Draw the area
Sketch a candidate area by hand on the map; the points inside it, the demographics and the employment figures all land on one screen.
-
Add your own data
Upload your branch list or your own measurements and query them across the Next Geo data library.
-
Export the result
Share the comparison — and GeoBrain’s written interpretation of it — as Excel, PDF or an image.
WHAT YOU CAN DO
Five capabilities, one workspace.
All five run in the browser, on the same map and on the same data infrastructure; they are not modules bought separately.
-
AI-Powered Insights
Perform sales potential forecasting, location scoring, and regional performance analyses with machine learning models.
-
Advanced Data Visualization
Instantly view demographic, economic, and sectoral data on a map for province, district, neighbourhood, or user-defined areas.
-
Cross Queries & Adding Your Own Data
Transfer your business’s data to the platform, analyse this data together with the existing data library, and produce customised outputs.
-
Data Output and Sharing
Make your presentations and internal team sharing easier by exporting all analyses in Excel, PDF or visual formats.
-
Route and Distance Calculation
Create routes between two or more points; plan your field operations with time and distance calculations.
PLATFORM SCREEN
The screen, from the platform itself.
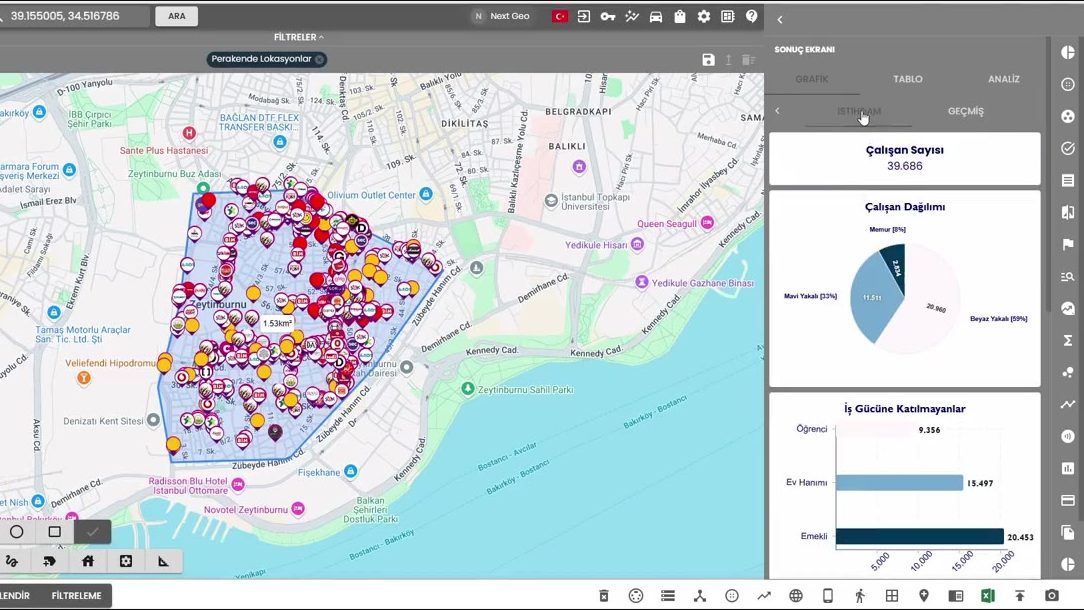
The frame below is taken from the Location Analysis Web interface. The map shows Zeytinburnu in Istanbul; the area has been drawn by hand, the retail points inside it have been fetched, and the results panel is open on the same screen.
01
Start from an address or a coordinate
Type an address or a coordinate into the field in the top bar and press ARA (Search). Where the screen opens is where the analysis begins.
02
Draw the area by hand
The toolbar at the bottom left offers freehand, circle and rectangle. The size of the drawn area is printed on the map — about 1.5 km² in this example.
03
Pick the layer with a filter
Whichever layer is open sits as a tag in the FİLTRELER (Filters) row — here it is Perakende Lokasyonlar, retail locations. The strip along the bottom carries the platform’s working modes — visualise, analyse, zone, filter — and the last two of the four are visible in this frame.
04
Read the result on the same screen
The SONUÇ EKRANI (Results) panel to the right of the map carries GRAFİK, TABLO and ANALİZ tabs — chart, table and analysis. The open employment tab shows the number of employees, how they break down, and who is outside the workforce.
The screenshot is taken from the platform itself, and its interface is the Turkish build. The district, the drawn area and the figures visible inside the screen belong to one example study; your installation shows your own areas, your own layers and your own data.
SAMPLE OUTPUT
What do you come away with?
The first panel is the candidate areas you drew, ranked on the same criteria. The second is a single address: its score, and GeoBrain’s reading of that score. Both come off the same screen and both export to Excel, PDF or an image.
SCORE RANKING · OUT OF 100
- 01 Kadıköy 87 LEADING
- 02 Ataşehir 82 −5 POINTS
- 03 Göztepe 79 −8 POINTS
- Population within a 10-minute drive of the leading area
- 84,300
- Areas compared
- 3
- Export formats
- Excel · PDF · Image
You draw the areas on the map yourself; the ranking is all of them scored on the same criteria. If you have uploaded your own branch or revenue data, that becomes one of the criteria too.
LOCATION SCORE
72/100
- Population within 500 m
- 18,400
- Population within 1,000 m
- 46,900
- Competitors within 1,000 m
- 4
- Pedestrian access
- High
WHAT GEOBRAIN WROTE
Within a 500 m walk there is a catchment of 18,400 people, and the daytime population runs above the evening one.
Pedestrian access is strong; vehicle access is weak because of the turn restriction on the main artery. Keep this site on the shortlist and re-check the rent ceiling against the 1,000 m population.
The two panels share a scale but do not measure the same thing: the first scores an area you drew, this one scores a single address. GeoBrain is not a separate product — it is the interpretation layer that comes with Location Analysis Web, and it delivers its write-up in Turkish; the lines above are shown in English here.
Sample output. The figures are illustrative. A real analysis is produced from your own candidate areas and your own data; the ten-minute drive band and the 500 m / 1,000 m radii are the same frame used in the other examples on this site.
The platform produces two things: what it concludes about a candidate site, and how that conclusion is drawn on the map. AI-Powered Insights reaches the conclusion; Advanced Data Visualization draws it in five types — hex grid, heat map, choropleth, clustering and point cloud. The two pictures below run in that order: first the reading, then the drawing.


INSTALLATION AND USE
Two installation models, one platform.
Next Geo’s web-based location analysis platform is offered in two separate models suitable for the technological infrastructure of institutions. The decision is about where the data sits; the capabilities are the same in both.

01 · CLOUD
Cloud Installation
Provides fast usage, low IT load and scalability. Update and maintenance processes are carried out by Next Geo.
02 · ON-PREMISE
On-Premise Installation
Ideal for situations where data needs to remain within the institution. It is installed and configured specifically for your IT infrastructure by the Next Geo team.
STANDARD IN BOTH
High performance, security and a user-friendly interface are standard in both models.
Users, permissions and any connection to your own systems are defined in the Setup and Integration step; the field team looks at the same data through Location Analysis Mobile.
Who is it suitable for?
-
Managers making growth and investment decisions
Candidate areas ranked on the same criteria put a table in front of the decision.
-
Brands looking to expand their retail network
Upload your existing branch list and query new candidates against it on one map.
-
Marketing and operations teams
Route and distance calculations produce the field plan; the export produces the presentation.
RELATED PAGES
- Location Analysis Mobile
- Setup and Integration
- Address Solutions
- Point Report
- Location and Area Selection
- Forecasting
NEXT STEP
Let’s put your data on the map.
Make data-driven decisions, not intuition, with Location Analysis Web. Tell us which areas you are weighing up and which of your own data should go in.