

SOLUTION · FORECASTING
How much will it sell, how many visits?
THE QUESTION ON THE SOLUTIONS PAGE
In the business world, success is no longer solely dependent on past performance, but on the ability to accurately predict the future. Next Geo’s forecasting solutions provide clear, measurable predictions about the future in many areas, from sales potential to customer traffic, regional growth scenarios to performance simulations.
THE ANSWER IS FOUR NUMBERS
- 01 Sales The potential unit sales of one point.
- 02 Visits The customer traffic expected at that point.
- 03 Conversion Sales over visits.
- 04 Revenue Unit sales and average basket, in money.
All four are computed not for one condition but for each condition separately — if competition increases, if income levels fall. The table below is one sample point forecast under three different conditions.
- 4FORECASTING TITLES
- 4STAGES
- 2SAMPLE OUTPUTS
All three numbers can be counted from this page: the four forecasting titles below, the four forecasting stages Next Geo publishes for this solution, and the two sample output panels.
SAMPLE OUTPUT
Three conditions, four numbers — side by side.
A forecast is not one number, it is a table. The first panel puts one sample point’s monthly visits, sales, conversion and revenue side by side under three different conditions; the second is the same sample brand’s regional expansion plan: which region, when, how many points. That is exactly the output the solutions page states for this solution — sales, visit, conversion and revenue forecasts for each scenario.
FORECAST UNITS, BY CONDITION
Base: today’s conditions continue.
Rival opens: a similar point opens within 500 m.
Income falls: regional income levels drop.
| FORECAST UNIT | BASE | RIVAL OPENS | INCOME FALLS |
|---|---|---|---|
| Monthly visits | 12,400reference | 10,900-12% | 11,600-6% |
| Monthly sales | 4,960reference | 4,140-17% | 4,520-9% |
| Conversion | 40%reference | 38%-2 pts | 39%-1 pt |
| Revenue index | 100reference | 83-17 pts | 80-20 pts |
Conversion is sales over visits. In the revenue index the base condition is 100; the index carries average basket as well as unit sales, so in the third condition — where the basket is assumed 12% lower — revenue falls further than units do. Bars and percentages are relative to the base condition. In real work you define the conditions.
RECOMMENDED ORDER AND TIMING
- FIRST 6 MONTHS Kadıköy 2 points POTENTIAL 87
- 6–12 MONTHS Ataşehir 1 point POTENTIAL 82
- 12–18 MONTHS Göztepe 1 point POTENTIAL 79
- 18–24 MONTHS Ümraniye 1 point POTENTIAL 71
The order comes from the potential score and the timing from the regional demand projection; five points in total, spread over two years. The score summarises, out of 100, the potential the model produces for that region. A recommendation is not a decision: where and when to open is the brand’s call.
Sample output. Figures are illustrative. Real output is produced from your point, your product and your data. District names are illustrative only and do not show any real brand’s plan; no customer data, revenue figure or case result is published on this page. The potential scores are the same values used in the other sample outputs on this site.
What does a forecast look like, and what does a plan look like?
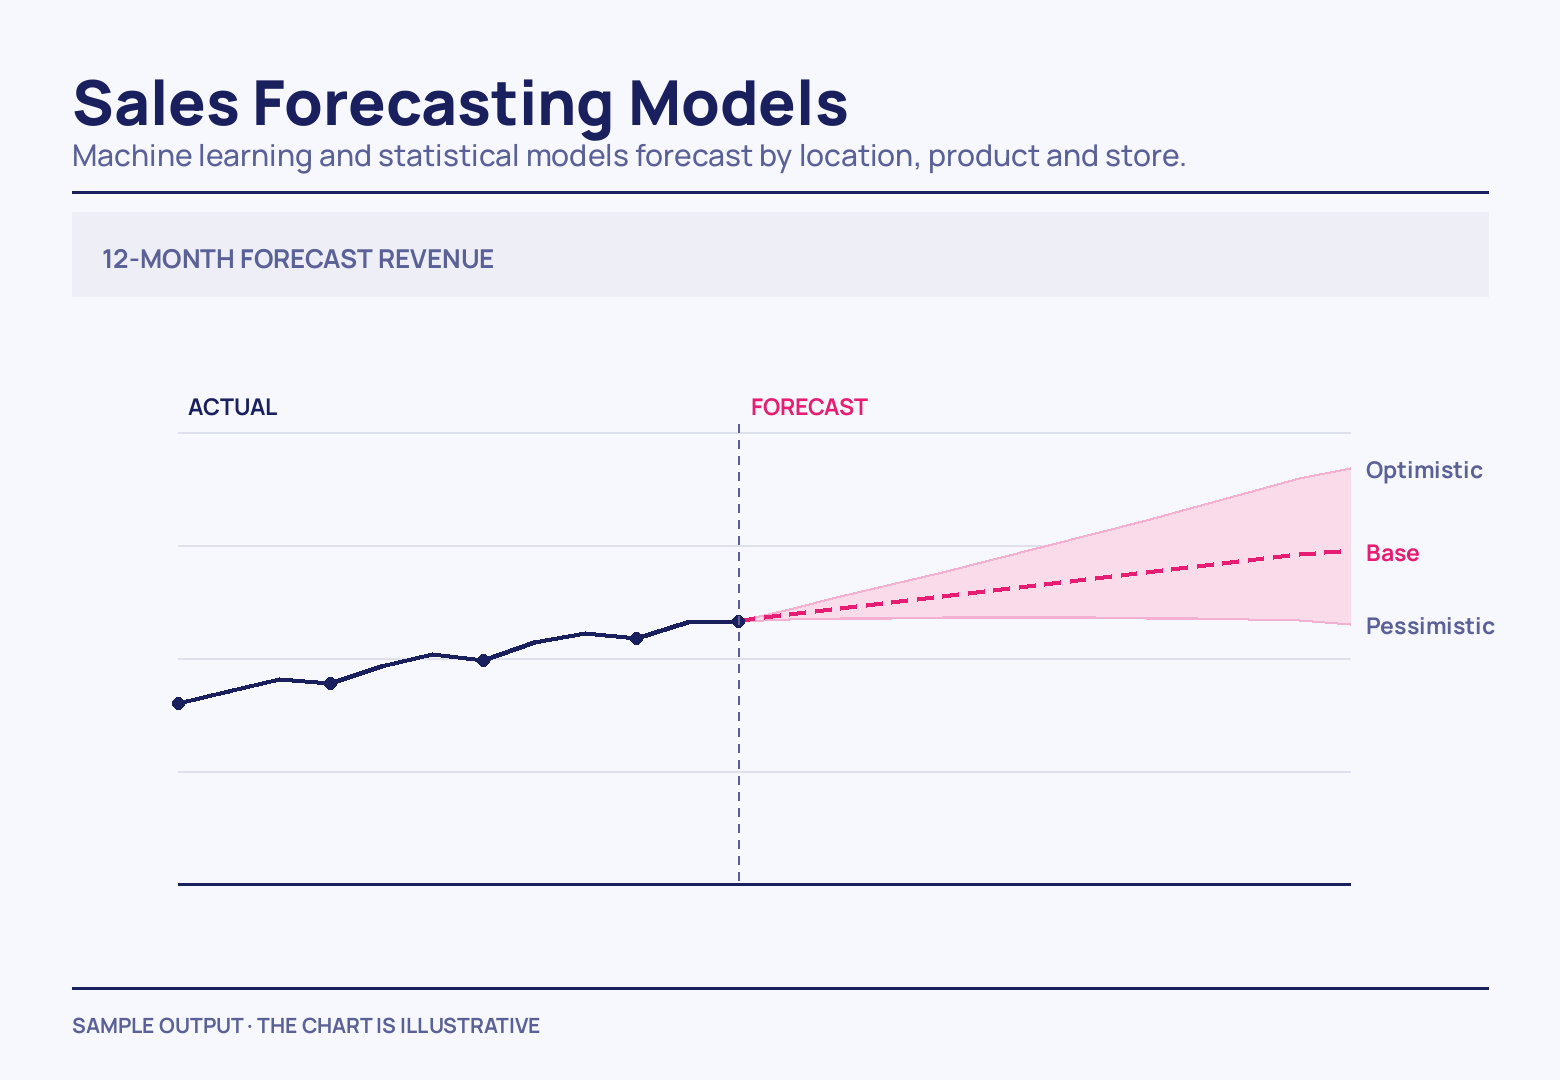
The two panels above give the numbers; these two titles set their shape. Sales Forecasting Models draws the twelve-month forecast not as a single line but as a band opening out between three curves — optimistic, base and pessimistic: the forecast itself is a range. Regional Expansion Planning ranks regions by potential and cuts them into entry waves — the highest-scoring region first, then a second wave, then the rest.

FORECASTING TITLES
Plan the future with data-powered predictions.
Four titles, two scales. The first two work out what a single point will do before it opens; the other two forecast for the whole network and for the calendar: which region, when, and how much to prepare for.

One point: what it will sell before it opens
-
Sales Forecasting Models
We analyze the potential sales figures of a new store or service point, taking into account factors such as regional income levels, competition, attraction power, and customer density.
-
Branch Performance Simulation
We visualize branch-based performance changes in different location scenarios, guiding you to the most efficient option.
A network and a calendar: where, and when
-
Regional Expansion Planning
We evaluate the scalability of your brand with regional demand and dynamics, predicting when and in which regions you should grow.
-
Forecasts for Operational Planning
We enable you to optimize your operational decisions, from inventory planning to personnel distribution, by basing them on local demand projections.
The point / network split is a reading order, not a separate package: all four work from the same data pool and the same model.
FORECASTING STAGES
From data to an action plan, in four stages.
The four stages are the sequence Next Geo publishes for this solution. The first collects the data, the second builds the model, the third runs the scenarios, the fourth writes the decision.

-
01
Data Collection and In-Depth Analysis
Using Next Geo’s rich data pool, the demographic structure, competitive landscape, attraction centers, income level, and regional dynamics of the target region are analyzed in detail. If necessary, company-specific data can be integrated into the system to expand the analysis.
- Demographic structure
- Competitive landscape
- Attraction centers
- Income level
- Regional dynamics
-
02
Modeling with Artificial Intelligence
Using machine learning and statistical analysis techniques, specialized prediction models are built based on location, product or store. Algorithms that are different for each sector and business model transfer past performance data into the future.
- Machine learning
- Statistical analysis
- By location
- By product
- By store
-
03
Scenario Building and Potential Calculation
Scenarios are developed that predict what will happen in different locations under different conditions (e.g., if competition increases, if income level decreases). Potential sales, visits, conversions, or revenue forecasts are made for each scenario.
- Sales
- Visits
- Conversion
- Revenue
-
04
Decision Support and Action Plan
The obtained prediction results are presented with visual reports. It is clearly recommended which region, when, and how growth or investment should be made. All predictions are transformed into a simple and actionable plan for decision-makers.
- Visual report
- Region
- Timing
- Action plan
Stage 01 asks you for two things: the address or coordinate of the point being forecast and — if it exists — past sales data from your current points, because the model carries past performance into the future. Matching, de-duplicating and verifying address lines is the job of Data Services; where the point being forecast should sit is Location and Area Selection; which customer group is where is Segmentation; and the visual report in stage 04 is published as Reporting.
NEXT STEP
With Next Geo, plan from today and be ready for tomorrow.
Which point, and under which conditions? Start with an address or a coordinate; if you have past sales data from your current points, the forecast gets stronger.
WHY SHOULD YOU USE FORECASTING?
Forecasting the future is not difficult; if you have the right data, the right model, and the right partner.
- 01Manage uncertainties with data.
- 02See potential risks and opportunities before investing.
- 03Lay a more solid foundation for strategic decision-making processes.
- 04Aim for accurate growth, not just rapid growth.